iPaaS in DevOps: Accelerating efficiency
 Updated Mar 6, 2025
Explore iPaaS use cases for software engineering

An Integration Platform as a Service (iPaaS) is a cloud-based technology platform that integrates different applications and systems. It’s a vital tool for businesses looking to automate their workflows, eliminate disparate data silos, and improve data quality across various software applications (and departments).
Other integration methods, such as point-to-point or API connections, are practical but have significant drawbacks. They’re often expensive and slow (and introduce security concerns). Point-to-point and homegrown API connections also require ongoing maintenance to handle API contract changes and ensure compatibility.
The Celigo Platform is specifically designed to resolve these issues. We have identified several key iPaaS application integration use cases in software engineering and DevOps that are often missed in broader discussions about application integration. Some engineers often lean towards direct API integrations or vendor-specific plugins to consolidate data and metrics. However, an iPaaS presents a simpler, more secure, and standardized solution. It removes the hassle of handling various fragmented solutions, offering a clear and unified view of data integration and metrics.
In this article, we’ll discuss essential iPaaS use cases for software engineering and DevOps, extending to XOps domains such as DevOps, EngOps, FinOps, and SecOps. We’ll demonstrate how this technology can change how we approach application integration.
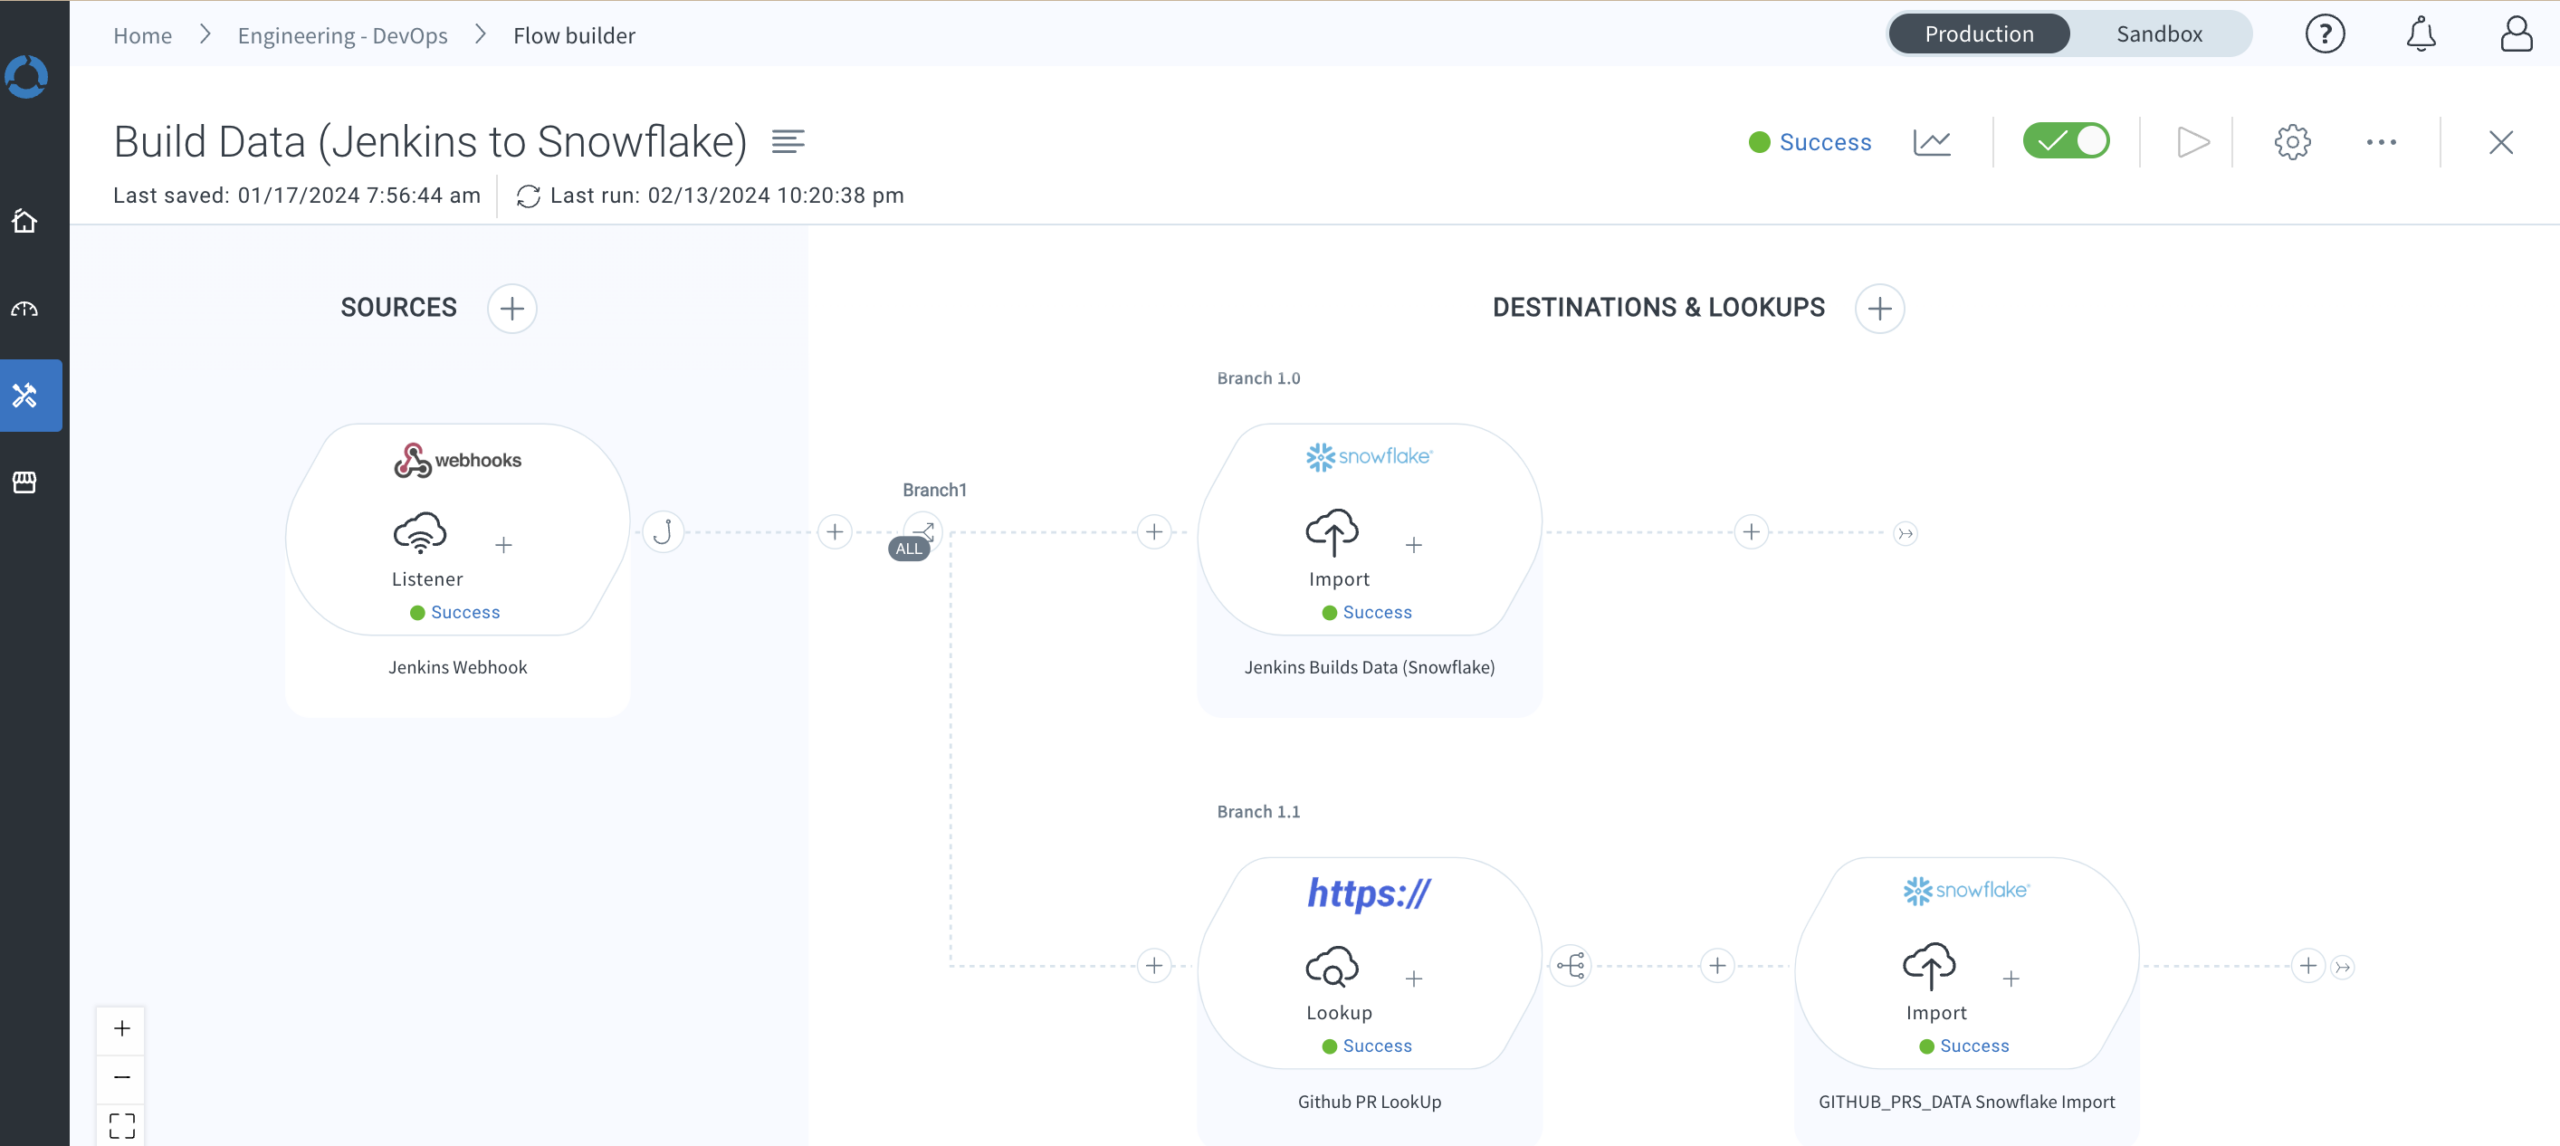
We’ll discuss data transfer into a central data warehouse, such as Snowflake. This data can then be analyzed using BI tools like ThoughtSpot to provide clear insights. This approach is crucial in overcoming the challenge of data silos across numerous applications, which traditionally obstructs a complete view of operations.
Key takeaways: Leveraging iPaaS in DevOps
- Improve your DevOps efficiency by leveraging DORA metrics, including Deployment Frequency, Lead Time for Changes, Change Failure Rate, and Time to Restore Service.
- Measure development efficiency with key productivity metrics such as cycle time, velocity, lines of code, code churn, code review metrics, and the Productivity Index.
- Use product telemetry data, including product performance metrics, usage analytics, feature usage, and error detection, to drive informed product development decisions.
- Monitor and manage the costs associated with cloud computing through key FinOps metrics like cost visibility, continuous monitoring, forecasting accuracy, and planned vs. actual budget analysis.
- In order to gain these metrics, integrate your key tools like GitHub, Jira, Jenkins, ArgoCD, New Relic, Splunk, AWS, Google Sheets, Bill.com, Mongo, and PageDuty with iPaaS.
Application integration: Use cases in software engineering and DevOps
DORA Metrics
DORA metrics stand as a cornerstone in evaluating the efficiency of software engineering and delivery processes. Originating from extensive DevOps Research and Assessment (DORA) team research, now a part of Google Cloud, these metrics serve as a compass for organizations striving to optimize their DevOps practices.
The four DORA metrics include:
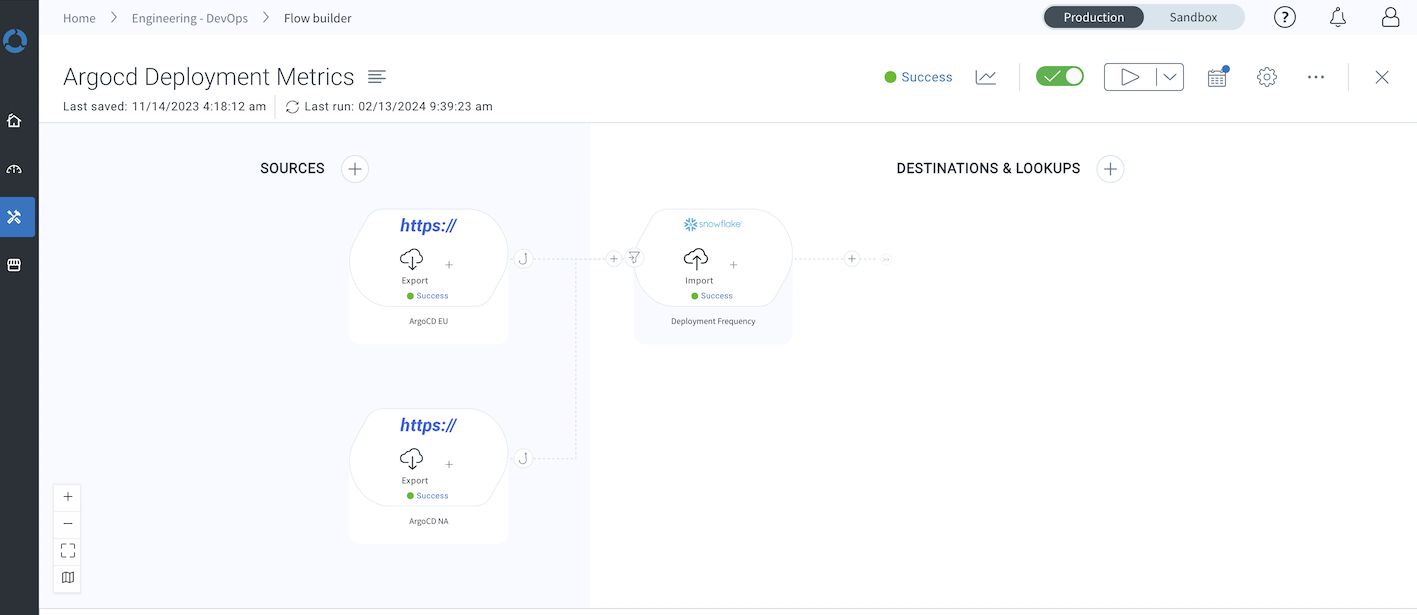
- Deployment Frequency (DF): This indicator tracks the rate at which an organization successfully deploys to production, offering insight into the agility and responsiveness of the deployment pipeline.
- Lead Time for Changes (LTC): LTC measures the duration from a commit’s integration into the version control system until its deployment into production, highlighting the efficiency of the software delivery process.
- Change Failure Rate (CFR): CFR quantifies the proportion of deployments that precipitate a failure in the production environment, serving as a gauge for the reliability of the deployment process.
- Time to Restore Service (TRS): This metric calculates the time required to recover from a deployment failure and return the service to its operational state, reflecting the team’s capability to fix issues quickly.
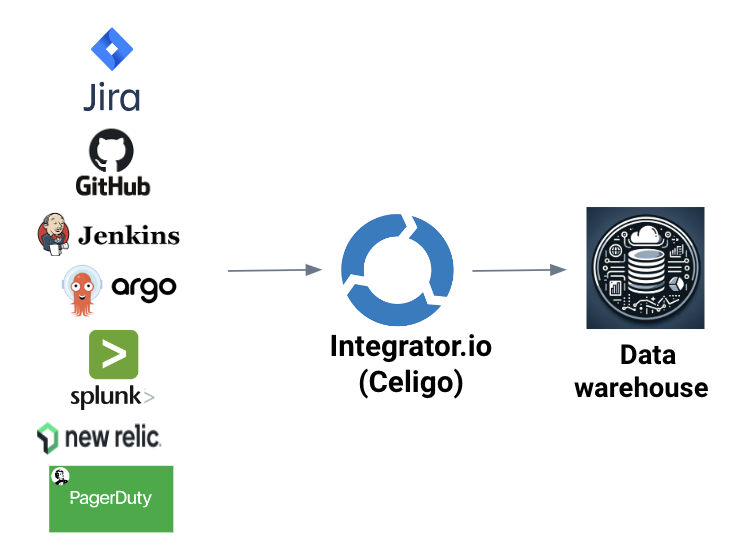
We integrated the tools below from our software engineering and DevOps lifecycle to get these metrics.
GitHub (Version Control), Jira (Project management and bug tracking), Jenkins (Continuous Integration) , ArgoCD (Continuous deployment), New Relic (Infrastructure monitoring) , Splunk (Log collection), PageDuty (Alerting)
Productivity metrics in software engineering
Productivity metrics are vital in assessing software engineering processes and teams’ effectiveness and efficiency. These metrics are essential for gauging how healthy software engineering activities are executed, pinpointing areas for enhancement, and fostering data-driven decision-making strategies.
Some key productivity metrics include:
- Cycle Time: This metric emphasizes the duration required to complete a specific development task or user story, from the onset of development to its conclusion. It’s instrumental in assessing the speed and efficiency of the development process.
- Velocity: Commonly used in Agile methodologies, velocity tracks the volume of work a development team completes during a specific iteration or sprint. It’s crucial for capacity planning and forecasting the scope of future projects.
- Lines of Code (LOC): LOC measures the size of a software program by counting the number of lines of code. Despite its simplicity, it’s often critiqued for not reflecting code quality or complexity.
- Code Churn: This metric monitors the extent and frequency of code modifications—encompassing additions, deletions, and alterations—over time. A high code churn rate may signal development instability or the necessity for repeated revisions.
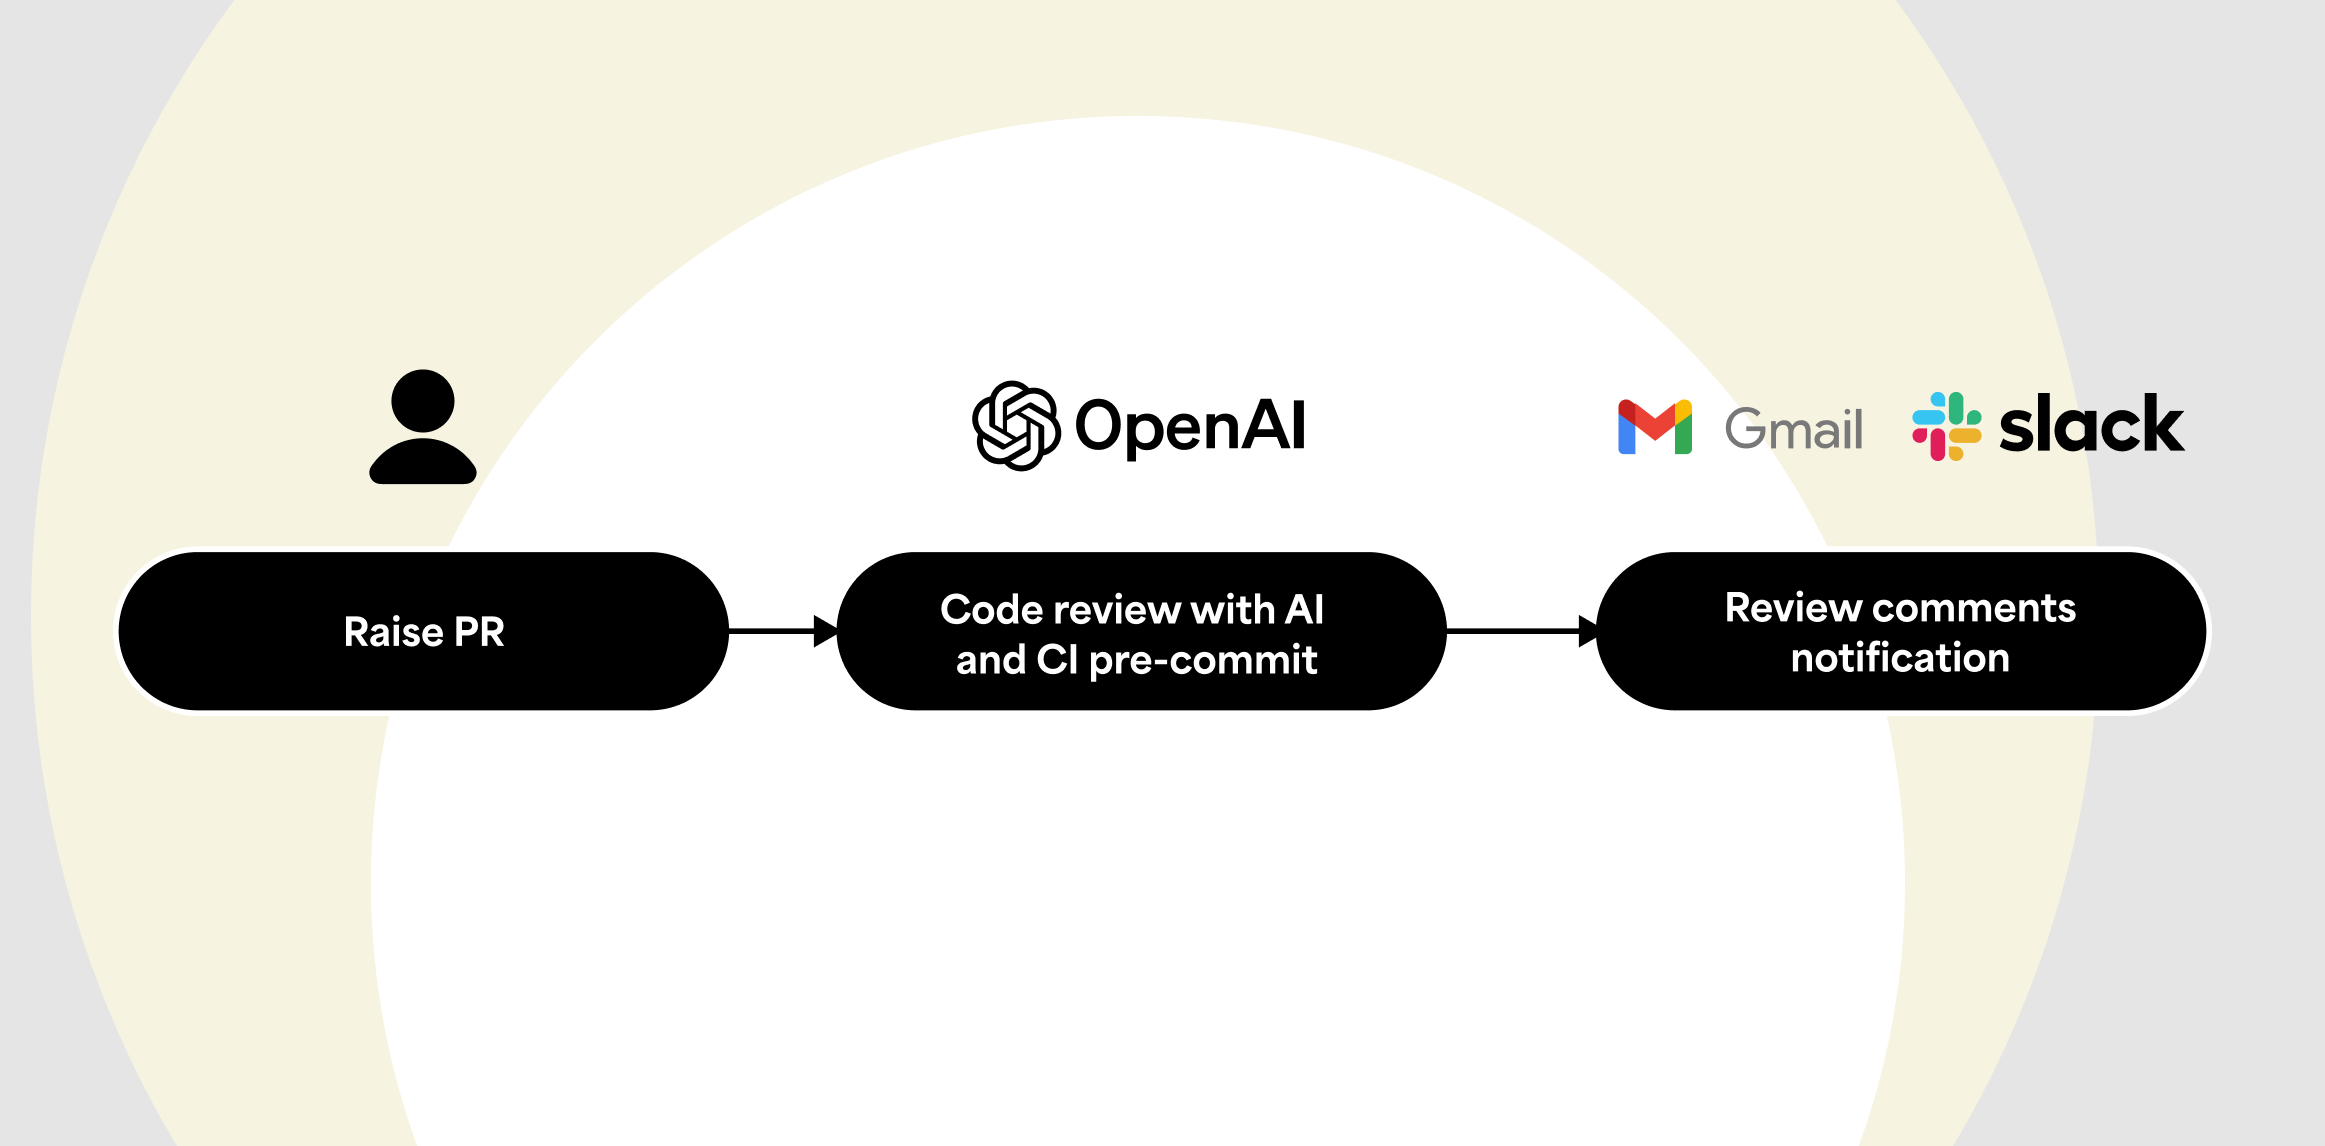
- Code Review Metrics: These metrics are tied to the code review process and include indicators such as the quantity of code reviews, review response times, and the ratio of issues identified and resolved during these reviews.
- Productivity Index: A composite index amalgamates various metrics to measure the development team’s productivity.
Integrating specific tools from our software engineering and DevOps lifecycle is vital for acquiring these metrics. Through an iPaaS, organizations can simplify collecting and analyzing these productivity indicators.
We integrated the below tools from our software engineering and DevOps lifecycle to get these metrics.
GitHub (Version Control), Jira (Project management and bug tracking), Jenkins (Continuous Integration)

Product telemetry for insights
Product telemetry involves collecting, analyzing, and understanding data on how users interact with a software product or service. It includes tracking user actions, preferences, behaviors, and the software’s performance.
Product telemetry plays a key role in shaping product development, improvement, and strategic decision-making through diverse tools and technologies.
Some key telemetry metrics include:
- Product Performance Metrics: These metrics, such as the number of records processed daily or the volume of workflows executed, provide insights into the product’s scalability and growth over time. Monitoring these figures closely can reveal trends and patterns essential for forecasting and capacity planning.
- Usage Analytics: At the heart of product telemetry lies the goal of understanding user interactions with the product. This involves analyzing which features are most popular, the paths users take within the application, and typical user workflows. Such analytics are vital for identifying engagement drivers and areas for improvement in user experience.
- Feature Usage: This metric focuses on the adoption and usage levels of specific product features or functionalities. It aids product teams in recognizing highly favored features and those that may require additional development, optimization, or user education efforts.
- Error Detection: Monitoring for unusual changes in performance metrics, like sudden drops in records processed, can serve as an early warning system for errors or issues within the data processing framework. Prompt detection enables quick resolution, minimizing impact on user experience.
We can efficiently gather and leverage these metrics by integrating specific tools from our software development and DevOps lifecycle. iPaaS solutions streamline this integration, facilitating a seamless flow of telemetry data across different platforms and tools.
This ensures that teams can access comprehensive, real-time insights, empowering them to make informed decisions, enhance product features, and ultimately deliver a superior user experience.
We integrated the below tools from our software engineering and DevOps lifecycle to get these metrics.
Splunk (Logs and metrics), Mongo (Datastore)


Optimizing cloud economics with FinOps
Financial Operations (FinOps) is a comprehensive set of practices designed to optimize and manage the costs associated with cloud computing and infrastructure in an organization.
It’s a critical discipline that merges financial management with cloud technology to ensure an organization’s cloud spending aligns with its business goals and objectives.
Some key FinOps metrics include:
- Cost Visibility: Central to FinOps is the principle of maintaining transparent visibility into all cloud-related costs. This requires deploying cloud cost management tools and practices capable of tracking spending details at a granular level. By understanding where and how resources are allocated, alongside usage patterns and their resultant costs, organizations can make informed decisions to optimize their cloud investments.
- Continuous Monitoring: An ongoing review of cloud usage and expenditure is vital within FinOps. This constant vigilance aids in detecting any irregularities, such as cost spikes, excessive spending, or underutilized resources, ensuring timely adjustments are made. Regular monitoring supports operational efficiency and cost-effectiveness, preventing budget overruns and resource wastage.
- Forecasting Accuracy: A critical measure within FinOps is the ability of a team to forecast its cloud spending with high precision. Accurate forecasting enables better budget planning, reduces financial risk, and ensures that cloud resources are aligned with project needs and business goals.
- Planned vs. Actuals: Comparing planned budgets against actual spending is essential in FinOps. This comparison helps understand spending trends and make necessary adjustments or reallocations to stay on track. Regularly analyzing planned versus actual expenses allows for more agile financial management and strategic decision-making in cloud resource utilization.
By implementing FinOps practices, organizations can achieve a balance between the agility offered by cloud computing and the discipline required for effective financial management. This strategic approach ensures that cloud investments contribute positively to an organization’s overall business objectives, maximizing the value of every dollar spent on cloud resources.
We integrated below tools from our software engineering and DevOps lifecycle to get these metrics.
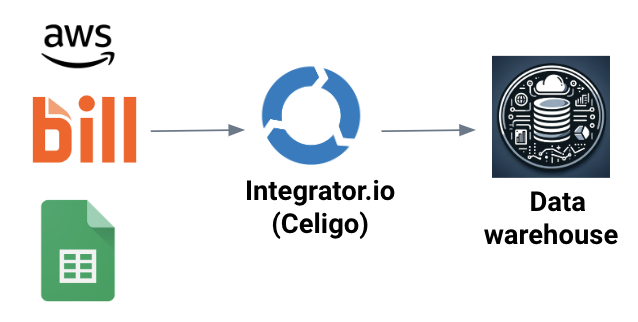
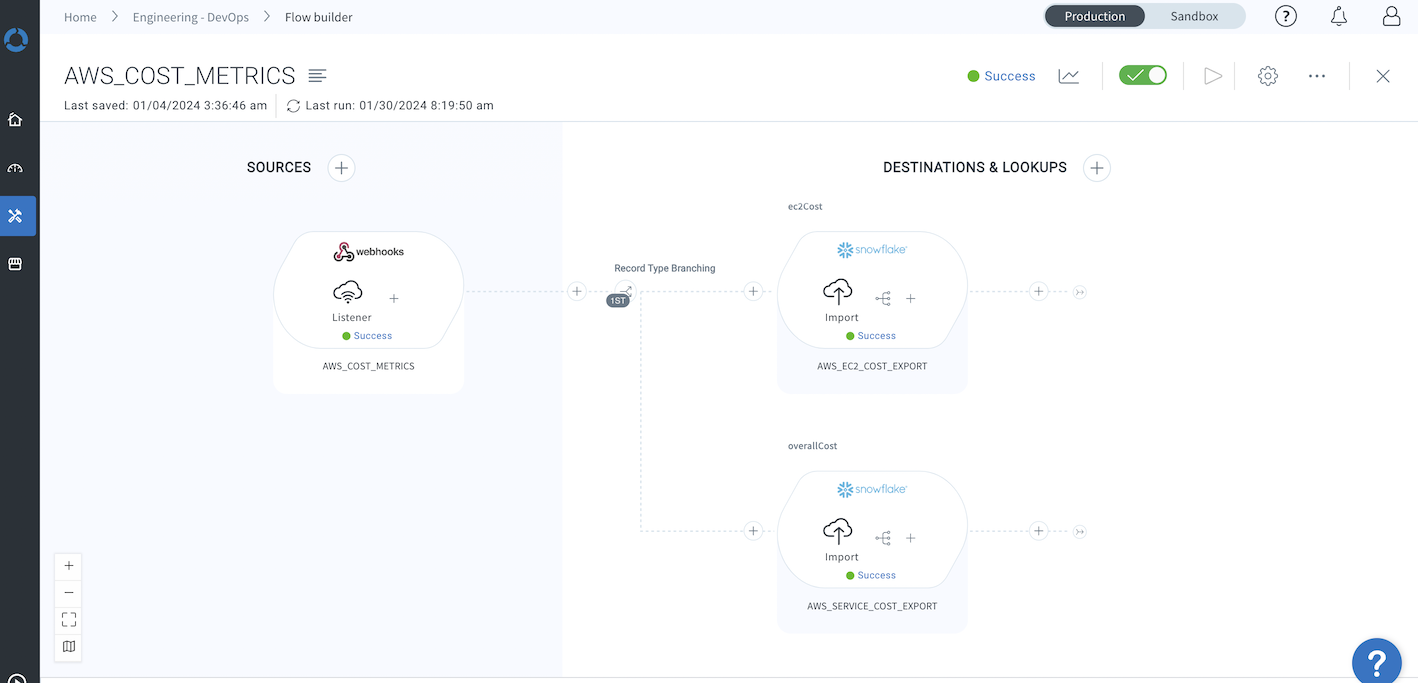
AWS, Google Sheets, Bill.com
Integrating SaaS applications via an Integration Platform as a Service (iPaaS)
There could be many use cases in XOps (DevOps, EngOps, FinOps, SecOps) domains where we can leverage application integration as we use many applications in this space that need integration. Integrating different SaaS applications through an iPaaS helps enhance efficiency and collaboration. This approach simplifies workflow and decision-making and drives innovation and growth by connecting disparate tools and technologies in a secure, standardized way.
Integration Insights
Expand your knowledge on all things integration and automation. Discover expert guidance, tips, and best practices with these resources.