Execution logs: Achieve end-to-end operational visibility
 Updated Jan 29, 2026

When a flow doesn’t run as expected, the first questions are usually the same: which records were processed, which ones failed or were ignored, and at which step a specific record’s outcome changed.
Without clear record-level visibility, it can be difficult to validate outcomes, understand unexpected behavior, or quickly identify where things went wrong, especially as flows grow in complexity and volume.
Execution logs for record-level observability
Execution logs capture a complete picture of each flow run, providing visibility into how each record was processed. This enhancement aids troubleshooting and auditing by providing a unified, consistent view of flow execution across development, testing, and production.
Execution logs quick demo
Execution logs provide:
- A single, unified interface for debug sessions and production runs
- Record-level traceability across steps, tools, transformations, and API calls
- Multiple logging modes so you can control how much detail is captured
- Payload visibility (including successful and ignored records) for external calls
Use execution logs when you need to answer “what happened in this run?” and “what happened to this specific record?” without modifying the flow or forcing errors.
How it works
Run-level and record-level views
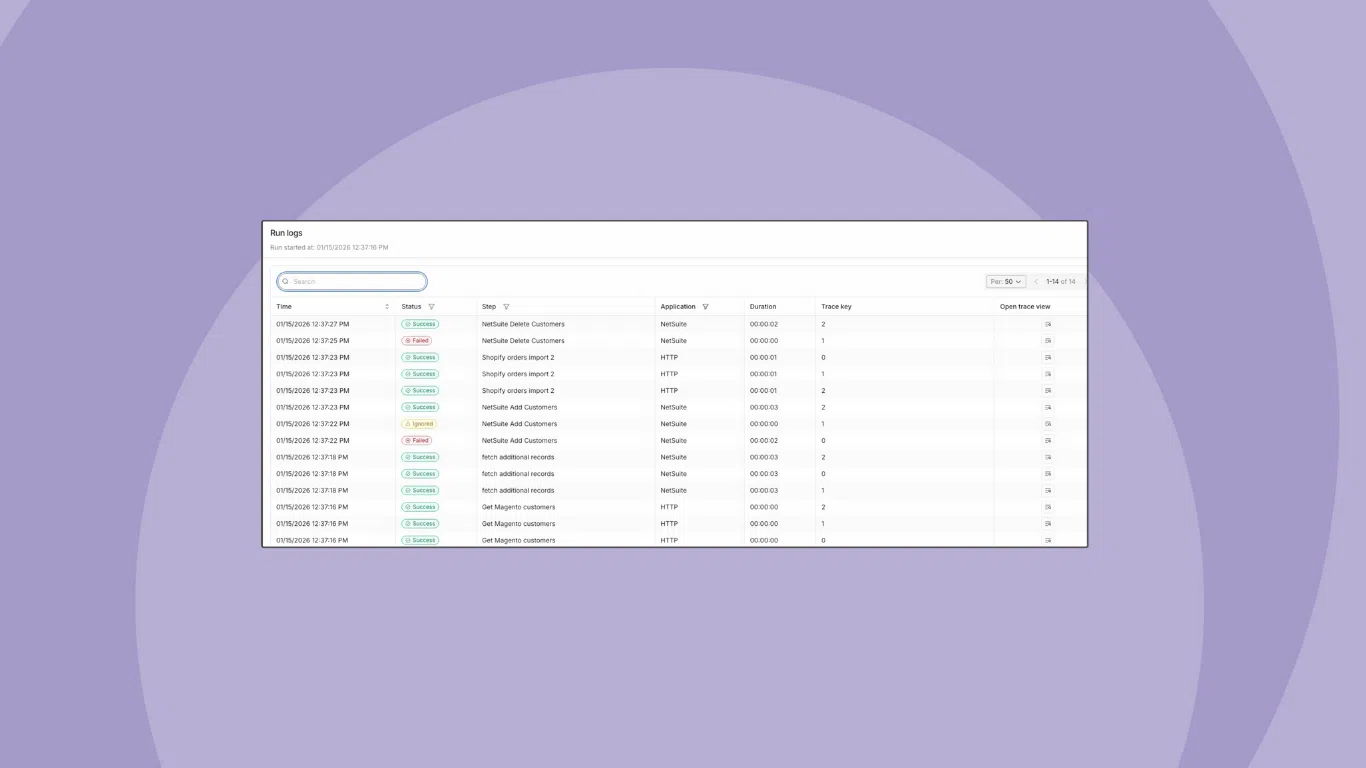
Execution logs start at the flow level. In your flow’s Run history, each run now has a Run logs entry.
Opening a run shows:
- All records processed in that run
- Status per record at each step (success, failed, ignored)
A single record may pass through multiple exports, lookups, filters, branches, and imports. The run view shows how it moved through the flow so you can quickly spot patterns or anomalies at the record level.
TraceView for a single record
When you need to troubleshoot a specific record, you can open TraceView from the run.
TraceView shows the record’s execution path across the flow in sequence, including:
- Steps visited, in order
- Status at each step
- Where the outcome changed (for example, from success to error or to ignored)
This lets you pinpoint the exact step that produced an unexpected result without manually stitching logs together.
Logging modes
Execution logs support multiple logging modes so you can balance visibility, storage, and noise depending on the situation.
|
Log Mode |
Best Use Case |
Details |
|
Basic Logging |
When you need quick answers, such as whether a record ran or which step it reached. |
Shows high-level execution context focused on external calls. |
|
Detailed Logging |
When you need to validate payloads and request/response details for external calls. |
Allows diagnosis of issues without forcing errors to see the data. Teams often move to this mode for payload-level evidence. |
|
Debug Logging |
When actively building or troubleshooting a flow, and needing deeper visibility. |
Provides visibility into external touch points such as pre-save page hook, result mapping, branching, input filters, and mapping. Allows seeing both the input and output at each troubleshooting step. Teams switch to this when they need to understand how the flow’s internal logic transformed or filtered a record. |
Bottom line: Execution logs make it faster and easier to trace exactly what happened to each record in a run and choose the right level of detail for the issue you’re debugging.
Integration insights
Expand your knowledge on all things integration and automation. Discover expert guidance, tips, and best practices with these resources.